
The eCaring Insights Dashboard provides a centralized view of your agency's key metrics and performance data over customizable date ranges. To access your agency's Insights Dashboard, select Insights from the Dashboard menu.

Once you select on Insights, you will taken directly to the KPI Dashboard
- A default date range is automatically selected when you open the dashboard. You can easily filter the displayed information by Office, Payor, Start Date, and End Date to view specific Key Performance Indicator (KPI) data that is most relevant to your agency.
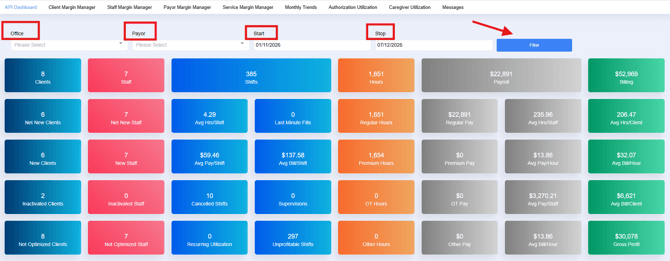
Note: In all areas besides the KPI Dashboard, you have the option to right-click to export the data as well as select the Export Option

Client Margin Manager
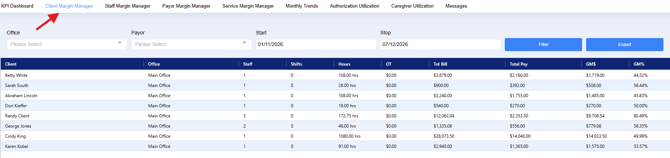
The Client Margin Manager allows quick at-a-glance information by client.
- In this section, you can filter the dashboard by Office, Payor, Start Date, and End Date to display specific data and view the details most relevant to your agency.
Staff Margin Manager
If you would like to view detailed staff performance and financial information, the Staff Margin Manager provides a comprehensive breakdown of key metrics. You can review information such as the number of clients assigned to each staff member, financial performance, margins, and other essential data to help optimize staffing decisions and achieve the best financial outcomes.

Payor Margin Manager
The Payor Margin Manager provides valuable financial metrics and performance statistics organized by payor. This dashboard allows you to analyze revenue, margins, and other key financial data to help monitor payor performance. You can also filter the information by Start Date and End Date to review statistics for a specific reporting period.

Service Margin Manager
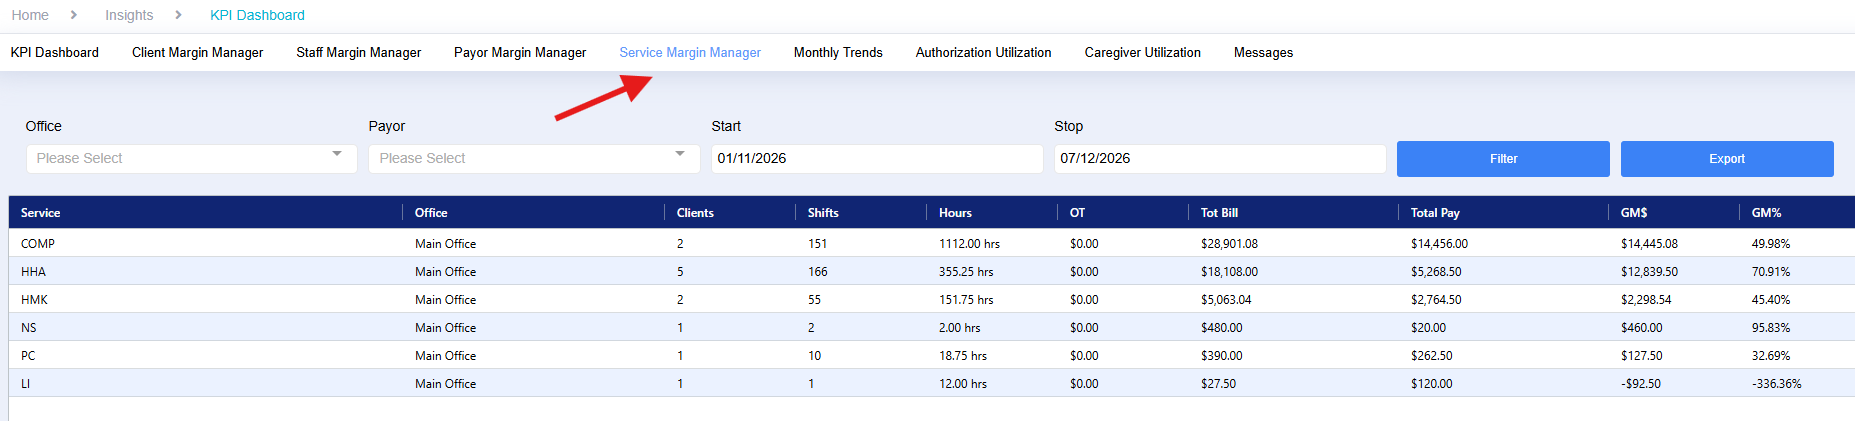
The Service Margin Manager provides an easy-to-read, comprehensive breakdown of financial metrics and performance statistics by service. This dashboard enables you to analyze revenue, margins, utilization, and other key performance indicators for each service offered, helping you make informed operational and financial decisions.
Monthly Trends
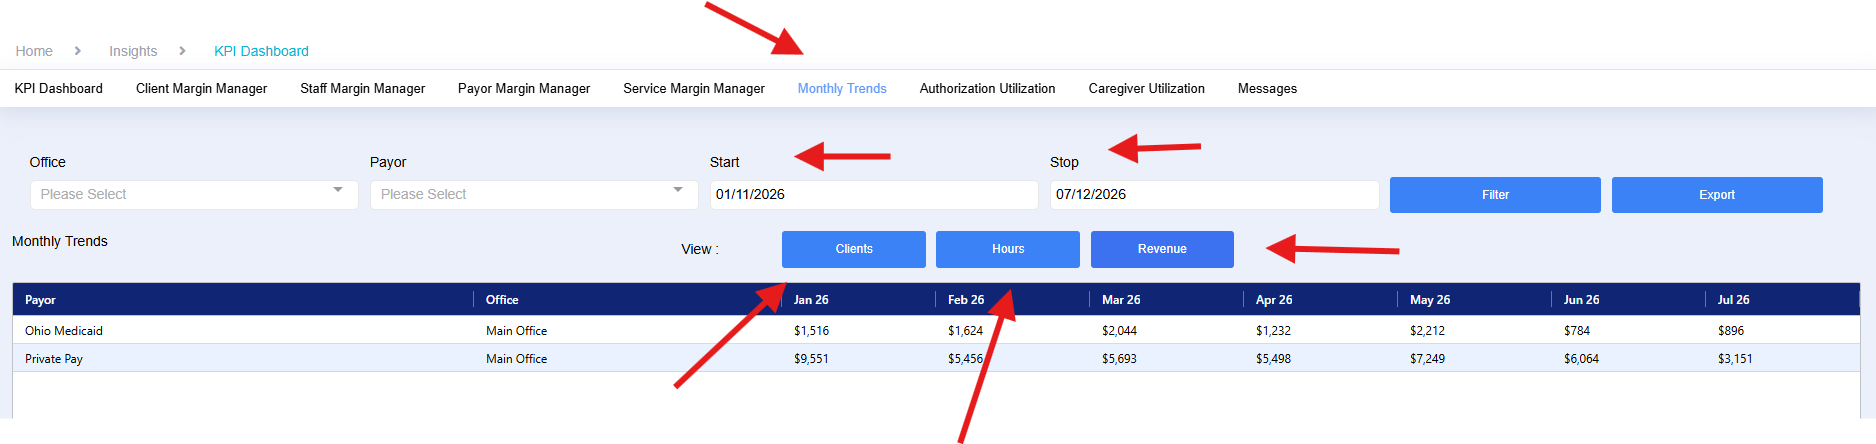
The Monthly Trends Dashboard allows you to customize and analyze key metrics, such as Clients, Hours, and Revenue, over a selected time period. Simply choose the desired Start Date, End Date, and metric from the available options to view trend data and monitor your agency's performance over time.
Authorization Utilization
The Authorization Utilization Dashboard provides a comprehensive overview of how authorizations are being utilized across your agency. The first section of the dashboard displays your agency's overall authorization utilization, allowing you to quickly assess how effectively authorized hours are being used. This high-level view helps identify utilization trends and opportunities to improve scheduling and maximize authorized services.

As you continue through the dashboard, you will find additional filtering options that allow you to narrow the data by specific criteria, making it easy to analyze the information most relevant to your agency's needs.

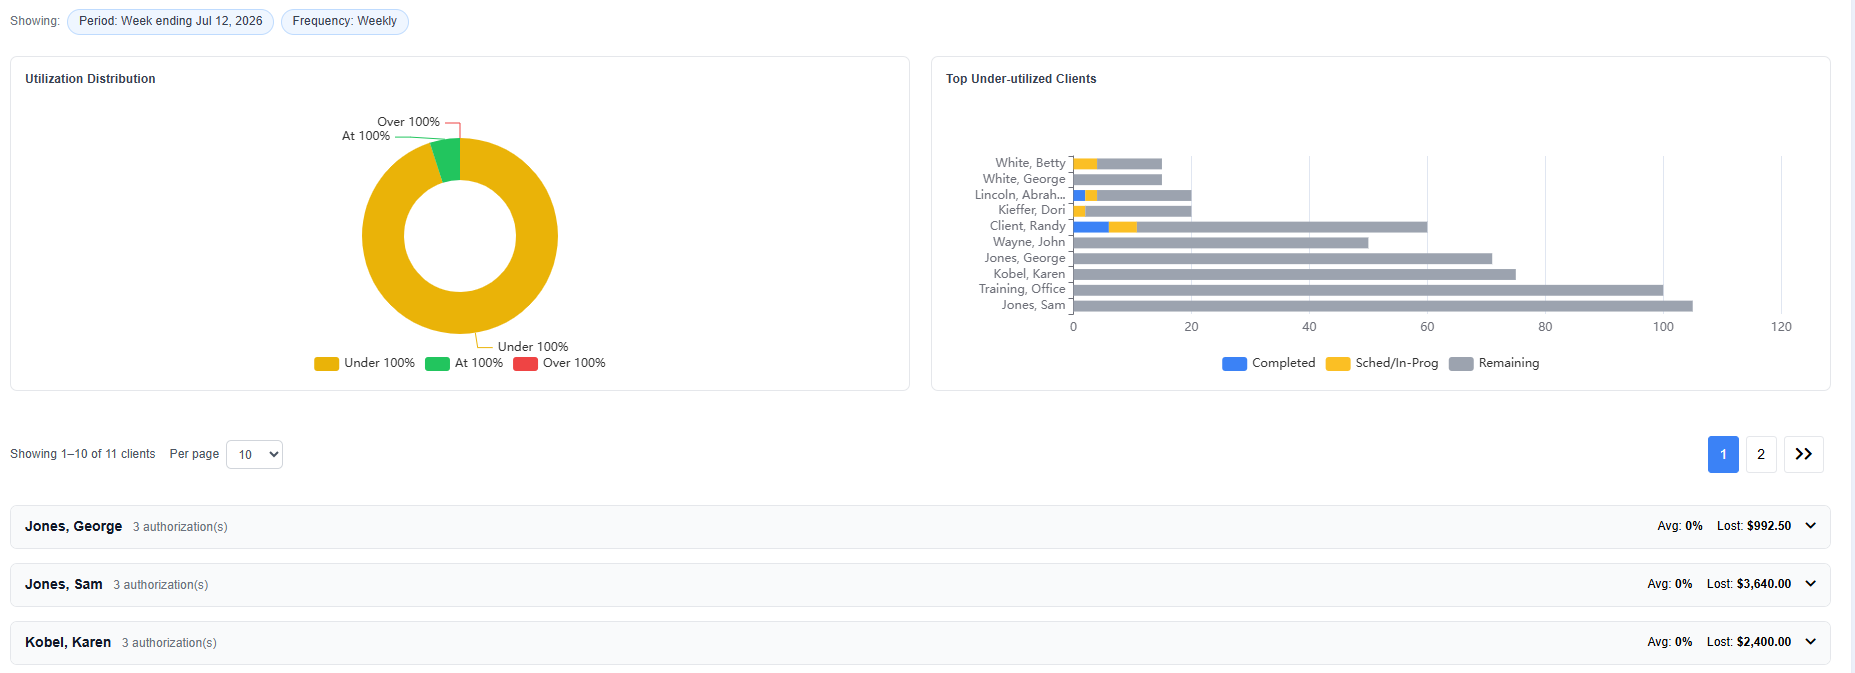
After applying the desired filters, the dashboard will display detailed authorization utilization data, including Utilization Distribution, Top Underutilized Clients, and client-specific utilization details. These insights help you identify trends, monitor authorization usage, and recognize opportunities to improve scheduling and maximize authorized hours.
Caregiver Utilization
The Caregiver Dashboard provides valuable insights into caregiver scheduling and availability. You can compare each caregiver's Desired Hours (configured by selecting Edit > Job Details in the staff profile) with the number of hours they are currently scheduled to work, as well as identify client coverage gaps. To ensure accurate reporting and meaningful insights, be sure to complete the Desired Hours field in each caregiver's profile.


Messages
The Messages Dashboard allows you to review all messages sent within a selected date range. You can track message delivery and determine whether each staff member has opened and viewed the message, helping you monitor communication and employee engagement.
